For over a decade, CFEs, auditors and analysts have used Benford’s Law to identify journal entry irregularities. Today, this analysis method remains relevant as ever as new applications using AI and simulation could bring Benford’s Law to the forefront of your fraud risk management controls.
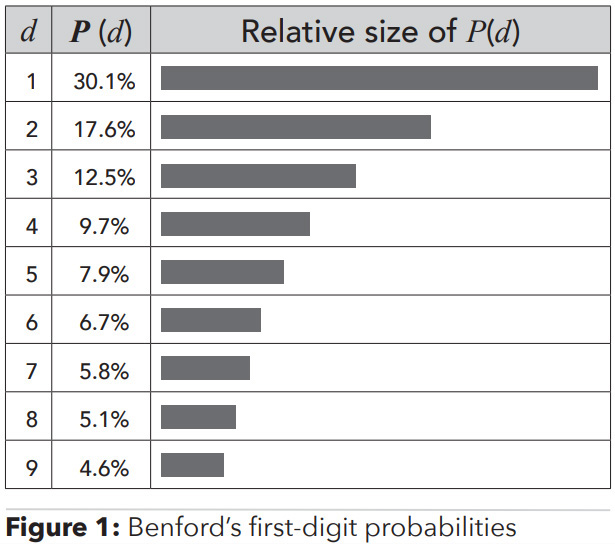
If you’ve passed the CFE Exam or the CPA exam, you’re familiar with Benford’s Law. This principle observes the unexpected regularity that in any large, randomly produced set of natural numbers, such as streamflow statistics, town and city populations, or corporate sales or payment amounts, around 30% of the numbers will begin with the digit 1, 18% with 2, and so on; with the smallest percentage beginning with the digit 9. Accountant and fraud investigator Mark Nigrini, Ph.D., popularized it in his book “Digital Analysis Using Benford’s Law,” first published in 2001. You’ve probably used Benford’s Law to analyze accounts payable amounts, purchasing card data and journal entries in your search for irregularities or risk areas. By searching for cases where the expected proportion of the first (as well as the first two, or even first three) digits in a payment or transaction stream don’t conform, you’ll find indications that someone might be overriding a control or manipulating the numbers — disrupting the digit patterns.
A dash of theory
A Scientific American article published last year tells the story of how Benford’s Law was originally identified in 1881 by astronomer Simon Newcomb. (See “What Is Benford’s Law? Why This Unexpected Pattern of Numbers Is Everywhere,” by Jack Murtagh, Scientific American, May 8, 2023, tinyurl.com/y7mne8jb.) Physicist Frank Benford made the same observation in 1938 and popularized the law — and attached his name to it. Some references attribute both names to the model, referring to it as the “Newcomb-Benford Law.” You may also see it referred to as the “law of anomalous numbers.” In many real-life sets of naturally occurring numbers, the first digit is likely to be small, starting with a 1, 2 or 3, for example. In sets that obey the law, the digit 1 appears as the first digit about 30% of the time, while 9 appears as the first digit less than 5% of the time. The first digit probabilities for 1 through 9 are as follows (zero isn’t admissible as a first digit even though we need to have the zero in some cases, such as 0.07):
The challenge with the current approach
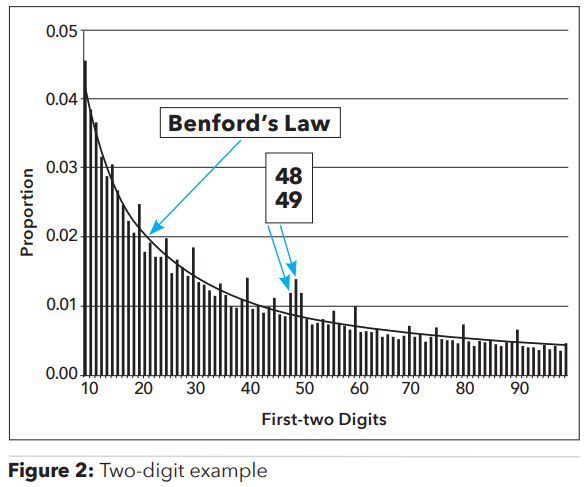
As simple and powerful as Benford’s Law is to run on datasets, it does have a limitation, which stems from looking at large datasets in an aggregate, linear fashion. Nigrini recommends that fraud examiners look at datasets of no less than 2,500 but ideally greater than 5,000 transactions when using the first-two digits test. In large global companies, the 5,000 threshold is easy to obtain as journal entries can span hundreds of thousands, if not millions, of transactions. The challenge lies with the ability to spot rogue behavior within a small business unit, or a group of individuals within a geographic area or other classification when looking at transactions in the aggregate. Risk transactions not matching Benford’s Law can be easily “washed out” given the sheer volume of today’s transactional activity.
Data visualization tools like Tableau or PowerBI can be helpful to filter down large bodies of data on a case-by-case basis, using geography, expense type or other criteria. The goal is to home in on potential rogue activities within a subset of the aggregate data in a way that targets and detects anomalies across thresholds. However, this approach can still be time consuming given the hundreds, if not thousands, of possible filtering combinations between geographies, business units, expense types, payment types and other factors used to drill into data.
But what if we could get a machine to run all these scenarios, instead of manually filtering one at a time?
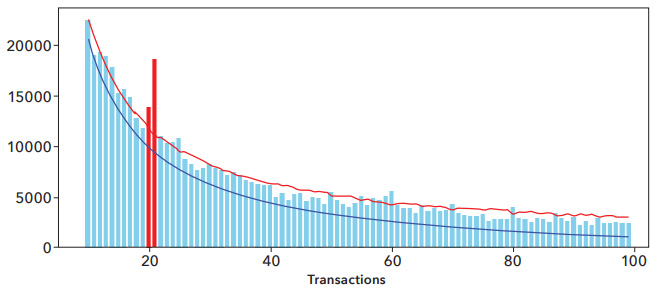

We then used BSDA and automation with elements of robotic process automation (RPA) to run the data across five distinct classifications to identify the subsets with the largest deviations from Benford’s Law, subject to the 5,000 minimum sample size constraint. The variables we ran during our testing included:
The model ran more than 17,808 combinations in about 21 minutes of data processing on commodity hardware to identify the subsets with the largest divergence. (Compare that to the time it would take to do it manually.)
The most anomalous subset turned out to be a certain vendor — we won’t name them here — with the attributes listed in the table on the right.
We then fed those transactions to a predictive, machine-learning model to find “more-like-this” statistically similar transactions to further enhance the results. The revised Benford’s analysis lit up with all sorts of anomalies within this subset.
Key observations
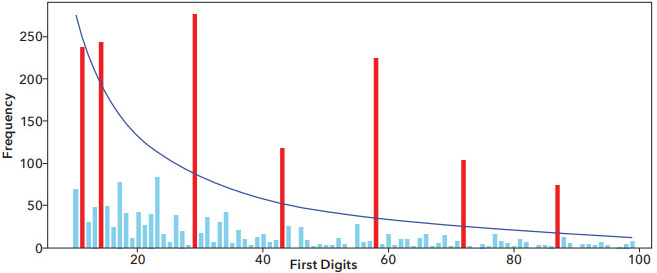
We provided those transactions to our customer for investigation, who deemed them anomalous enough to launch an investigation, which is ongoing. The investigators of this case shouldn’t only review vendor CCUS10 but also the related subsets, such as transactions in 2023 and 2022, or expenses posted to the same expense or asset account.
Benford’s Law for the future
Benford’s Law has been, and always will be, a useful fraud detection tool. Now, with the use of better technologies and automation, techniques like BSDA allow investigators to identify the most anomalous subsets quickly and efficiently, turning what was once a time-consuming process (seldom even attempted) into a powerful automated tool for uncovering hidden fraud patterns in big data. FM
Vincent M. Walden, CFE, CPA, is the CEO of Kona AI, whose company mission is to empower compliance, audit, and investigative professionals with researchdriven, innovative, and effective analytics to measurably reduce global fraud, corruption and enterprise risk. He works closely with CFEs, internal auditors, compliance, audit, legal, and finance professionals and welcomes your feedback and ideas. Contact Walden at vwalden@konaai.com.

Vincent M. Walden
Author
This article was originally published in Fraud Magazine on November / December 2024.
Discover how konaAI can help you identify and reduce risk while showcasing the effectiveness of your monitoring, auditing, and investigations programs.

See more. Know more. Stay ahead.
AI-powered analytics and insights for Internal Audit and Compliance professionals.
USA: 3800 North Lamar Boulevard, Suite 200, Austin, TX 78756
INDIA: 2nd Floor, iKeva, Divyasree Trinity, Block 2, Phase 3, HITEC City, Hyderabad, Telangana – 500081
© 2025 Copyright konaAI Corp, All Rights Reserved.
konaAI products are designed for use with SAP® R/3® & Oracle.
| Cookie | Duration | Description |
|---|---|---|
| cookielawinfo-checkbox-analytics | 11 months | This cookie is set by GDPR Cookie Consent plugin. The cookie is used to store the user consent for the cookies in the category "Analytics". |
| cookielawinfo-checkbox-functional | 11 months | The cookie is set by GDPR cookie consent to record the user consent for the cookies in the category "Functional". |
| cookielawinfo-checkbox-necessary | 11 months | This cookie is set by GDPR Cookie Consent plugin. The cookies is used to store the user consent for the cookies in the category "Necessary". |
| cookielawinfo-checkbox-others | 11 months | This cookie is set by GDPR Cookie Consent plugin. The cookie is used to store the user consent for the cookies in the category "Other. |
| cookielawinfo-checkbox-performance | 11 months | This cookie is set by GDPR Cookie Consent plugin. The cookie is used to store the user consent for the cookies in the category "Performance". |
| viewed_cookie_policy | 11 months | The cookie is set by the GDPR Cookie Consent plugin and is used to store whether or not user has consented to the use of cookies. It does not store any personal data. |